

Table of Contents
A Rocky Road Into July
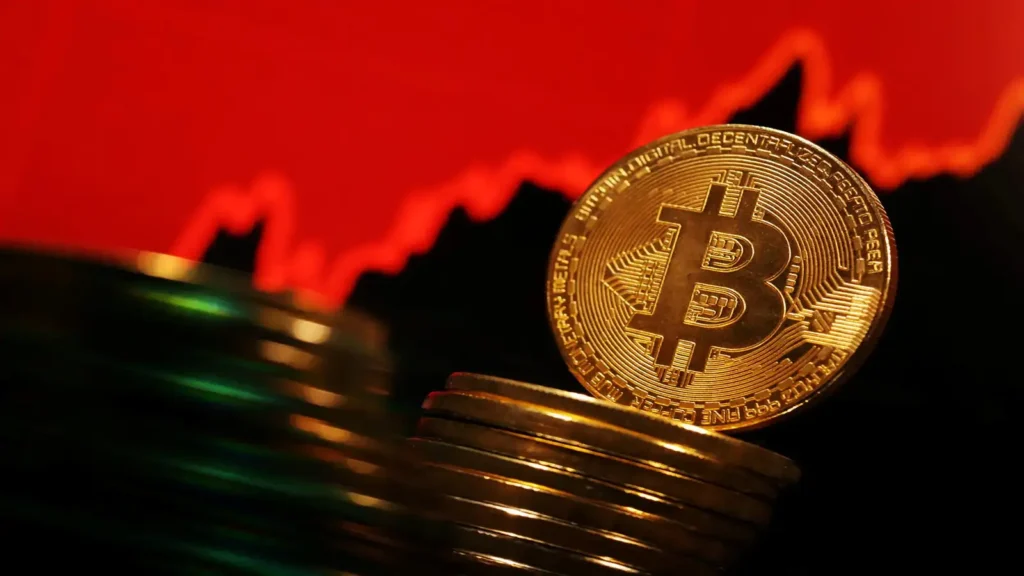
Bitcoin entered July 2026 with plenty of scars. After months of market pain, BTC finally found some footing, trading between $62,000 and $64,500 in the first two weeks of the month. This came on the back of a sharp fall to $58,000 in late June the lowest level in almost two years. In just eight months, the price collapsed 54% from its all-time high of $126,000 last October. For the record, that’s also a 37% drop from its January opening at $93,000.
Still, this time feels different. Unlike past crashes no major exchanges went under, no stablecoin unpegged, no high-profile protocol blew up. The basic plumbing of the crypto world stayed solid. Instead, outside factors like monetary policy, shaky global politics, and tricky liquidity had the biggest influence. And for once, spot Bitcoin and crypto stock prices went in completely different directions.
Looking Back: How Did We Fall So Far?
To really understand where Bitcoin stands now, you have to look back at what went wrong. After topping out in late 2025, things got rough fast. Central banks, with the U.S. Federal Reserve leading the way, got aggressive about fighting inflation. They kept interest rates high, squeezing risky assets everywhere stocks, crypto, you name it.
As a result, Bitcoin-based investment funds (especially spot ETFs) saw money flow out all through the spring. On top of that, tensions in the Middle East and wild swings in energy prices made big investors nervous. So traders backed away from big bets, and a lot of leverage quickly disappeared.
By late June, Bitcoin sank to a key support level at $58,000 for the second time in the cycle, forming what traders call a “double bottom.” When selling slowed and buyers returned, Bitcoin bounced back above $63,000 in July.
Technical Levels to Watch in July
The tech charts show Bitcoin trying to regroup. As of mid-July, the price sits around $62,700 to $64,000, up about 6% in the past week.
Key price zones:
- Immediate resistance at $63,850–$64,500. This is where a lot of sellers tend to show up. So far, Bitcoin’s had a hard time staying above this range.
- Major resistance at $65,000–$67,000. A close above this zone with more trading volume could send prices toward $70,000 and above.
- Main support at $60,000–$61,000. Buyers often step in here to defend the price.
- Cycle floor at $58,000. If Bitcoin falls below this, it could test even lower levels around $52,000.
The momentum indicator called the Relative Strength Index (RSI) now hovers near 50, showing neither big excitement nor deep fear.

Why Macro Matters Now
This summer, the Federal Reserve’s plans and global events are driving crypto. It’s not so much about what’s happening inside crypto itself.
All eyes are on the upcoming Fed meeting in late July. Markets want to know: will U.S. policymakers finally talk about cutting rates, or will they stay strict? Right now, many traders believe Bitcoin can hold above $60,000 unless the Fed surprises everyone with more tough talk.
Political headlines are also keeping the market on edge. Earlier this month, rising conflict in the Middle East caused a quick selloff, only for peace talks to spark a rapid recovery. Short sellers lost nearly $100 million in one wild day. It’s a reminder that volatility hasn’t gone away big moves can happen fast.
Who’s Buying? Institutions Re-enter the Ring
Institutional players set many of Bitcoin’s biggest moves, and in July, their behavior has changed. After months of net selling, U.S. Bitcoin spot ETFs showed strong inflows again it’s the best two-day streak for fund inflows since Spring.
Some recent figures:
- Biggest single day ETF inflow: $265 million (early July)
- Bitcoin dominance: 58% (capital still sticking with BTC over smaller coins)
- Fear & Greed Index: 30–38, showing caution over wild optimism
On-chain, big holders (“whales”) added to their positions during the late June lows, picking up more than 1.8% extra coins. And the amount of Bitcoin left sitting on exchanges keeps shrinking. This hints that investors are putting coins in long-term storage rather than getting ready to sell.

Spot Bitcoin and Crypto Stocks: A Widening Gap
Perhaps the biggest story this summer is the gap between Bitcoin itself and the stocks of crypto-related companies. While Bitcoin is down about 50% from its all-time high, publicly listed crypto firms have seen even larger losses:
- Gemini Space Station stock is down nearly 90% from its listing price less than a year ago.
- BitGo Holdings trades 77% below its January valuation.
- Bullish stock has lost 71% since launch.
These numbers tell us that, during the boom, investors got ahead of themselves with big expectations for crypto companies. When volumes dried up, those stocks took a major hit. Funds now prefer holding the underlying Bitcoin over shares in companies dealing with high operating costs.
Mining Adjusts to New Reality
Crypto mining isn’t what it used to be. Since the 2024 halving, lower block rewards and weak prices have forced miners to become more efficient. Take BitFuFu, a big mining outfit:
- Their managed computing power (hashrate) dropped from 19.5 to 15.3 exahash per second between May and July as they cut costs.
- They’re swapping out old hardware for new, more efficient machines, getting more out of every dollar spent on electricity.
- Self-mining is up even though total mined coins dipped, BitFuFu now uses more of its own machines, not client-hosted rigs.
Even so, the Bitcoin network stays safe. Its overall computing power (hashrate) remains high above 600 exahash, well beyond danger levels.

Three Possible Paths for the Rest of the Year
So, what’s next? Analysts see three likely scenarios between now and December:
- Bullish: The Fed hints at interest rate cuts and ETF buying hits over $500 million a week, sending BTC toward $75,000–$85,000.
- Neutral: The Fed keeps rates steady, markets stay calm, and Bitcoin grinds sideways between $60,000 and $68,000.
- Bearish: The Fed says inflation’s still a problem, funds pull out, and Bitcoin sinks back toward $52,000–$58,000.
Right now, most expect more range-bound trading, unless the Fed signals a major shift.
What Comes After the Great Decoupling?
As July closes out, there’s cautious optimism. The worst selling might be finished, with big buyers returning at the cycle low. But Bitcoin still needs to break above $64,500 and then $67,000 before people can call this a proper recovery.
All eyes are on the Fed’s late-July decision because once those meeting notes drop, the next big move for Bitcoin will come into focus. For now, Bitcoin’s underlying systems and investor interest look solid, even if the wild highs of 2025 feel pretty far away.
Disclaimer: Crypto markets are volatile and subject to regulatory changes. This article is for information purposes only and not investment advice.