
Table of Contents
Introduction
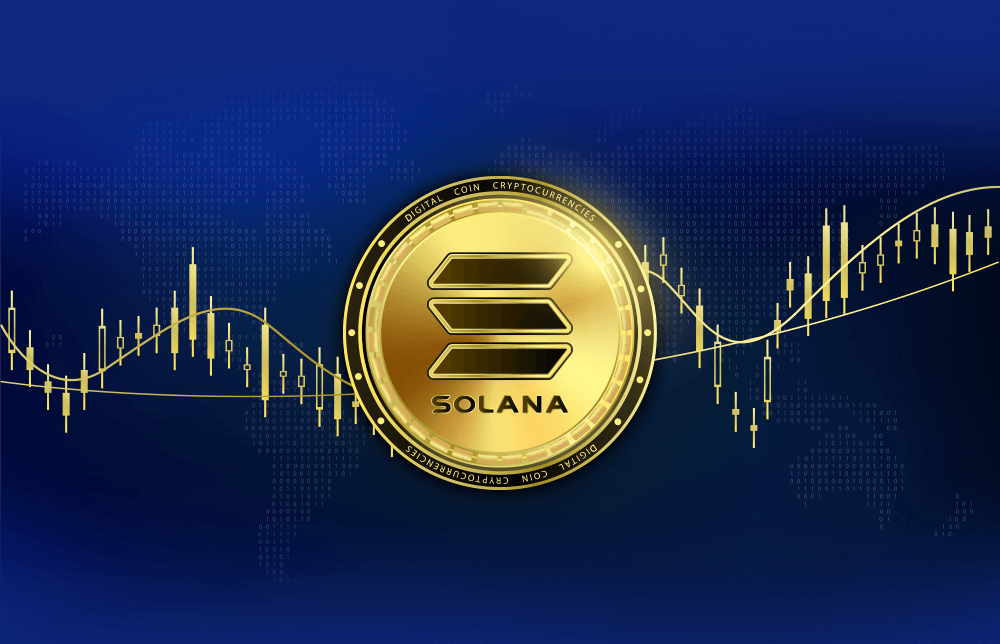
Solana ($SOL) stood out as one of the most active blockchain networks from January through September 2026. Over these nine months, it saw rapid network growth, big swings in price, and several new records for on-chain activity. Despite a tough global economy, Solana pushed forward as a leading platform for decentralized apps, digital trading, and tokenized assets. This report looks closely at Solana’s performance across the first three quarters of 2026, covering price trends, key network statistics, and what carried Solana through both good and bad moments.
Price Performance: Ups and Downs
Solana started 2026 trading at $102.50 (₹9,108). Across the next nine months, the price wasn’t steady it rose quickly in the first quarter, dropped in the second, and then surged again in the third.
For numbers people, here are the key stats:
- Q1 2026 Opening: $102.50 (₹9,108 INR)
- Q1 Closing: $112.00 (₹9,952 INR), up 9.27%
- Q2 Closing: $98.50 (₹8,752 INR), down 12.05%
- Q3 Closing: $117.20 (₹10,413 INR), up 18.98%
- Overall, Jan–Sep 2026: Up 14.34% year-to-date
Solana briefly touched highs near $148.50 (₹13,195 INR), and at its lowest, fell to about $88.50 (₹7,864 INR). The network’s market cap, as Solana’s value grew, ranged between $62 billion and $68.5 billion (about ₹5.5 trillion INR). It managed to keep between 3.1% and 3.3% of the whole digital asset market by value.
What Drove Performance Each Quarter?
Q1 2026: A Strong Start
Solana had a rough but exciting first quarter. Early January kicked off with heavy buying from retail traders, pushing price to a high of $148.50. Meme coins and decentralized app activity helped too. By late January, Solana stood as one of the best-performing blockchains, beating bigger Layer-1 rivals.
But February turned the tide. Higher US inflation made investors nervous the Federal Reserve didn’t cut interest rates as fast as people hoped, and government bond yields spiked close to 5%. That pushed the price of Solana down, testing lows near $88.50.
Even with this sharp dip, Solana’s actual usage didn’t slow. Q1 saw 10.1 billion total on-chain transactions (7.54 billion of those were successful non-vote transactions, which are most “real” user activity). This set the stage for a recovery in March, and Solana ended the quarter with a net gain of over 9%.
Q2 2026: Holding Steady, But Losing Ground
The second quarter was a time of waiting and watching. Solana opened April at $112.00 and tried to bounce back in May, briefly reaching $135.20. But the world wasn’t friendly to risky assets high energy prices, political tension, and cautious investors dragged things down. This quarter closed with the price slipping to $98.50, a loss of 12%.
Q2 wasn’t just about price. It was about real-world assets (RWA). Solana grew its reputation for on-chain treasury bonds, private credit, and tokenized investment products. Institutional players liked Solana’s speed and low fees. Native USD Coin (USDC) liquidity was strong, holding steady at $16.5 billion on Solana, which kept trading smooth for decentralized lending platforms like Kamino and MarginFi.
Even as price dropped, usage didn’t collapse. Solana handled 7.19 billion successful non-vote transactions (just about 5% less than Q1). This stability kept the network healthy, waiting for the next big move.
Q3 2026: New Records, Real Momentum
Quarter three is where Solana came back in a big way. Starting July at $98.50, the price hovered for a bit but exploded upwards in August and September. On-chain activity reached new heights:
- 14.2 billion total transactions (45% more than Q2)
- 8.92 billion successful non-vote transactions
- That’s about 1,122 transactions every second on average!
Other big stats from Q3:
- App revenue soared 48% to $299.1 million
- Record $7.1 billion in tokenized stock trades
- Decentralized exchanges on Solana handled $197.2 billion in spot volume, keeping a 36% market share for nine straight quarters
- Active daily addresses grew 12% (now averaging 4.1 million), and total wallets holding $SOL jumped up 20% to 8.38 million
A major turning point was in September, when the US Federal Reserve cut rates by 0.5%. This boosted global risk assets, helping Solana reach $138.80 by late September. Although it settled to close at $117.20, that was still a hefty 19% gain for the quarter.

Network Growth: Activity Beyond Price
There’s more to Solana than price swings. The whole network kept growing:
- Validator nodes went up over 1,500 consensus validators were active
- About 68% of all SOL tokens were locked for staking, showing faith in the network
- More people started using Solana officially for payments, with $262.7 million in credit and debit card volume processed on-chain in Q3
- Stablecoin holders shot up to 13.07 million, up 16% for the quarter
Big upgrades were on the horizon, too. The “Alpenglow” upgrade (meant to reduce transaction finality to just 150 milliseconds) was ready for mainnet testing. Jump Crypto’s highly anticipated “Firedancer” consensus client was getting close to multi-client release, promising more speed and resilience.
Comparison With Other Assets And Markets
Solana didn’t exist in a vacuum. Here’s how it stacked up against other major investment options as of September 30, 2026:
- Gold: +21.4% (top performer, thanks to inflation worries and central banks buying more gold)
- Bitcoin: +19.2% (helped by ETF inflows and reduced new supply)
- Solana: +14.34%
- S&P 500 Index: +12.8% (the main US stock index hung in there, on strong tech earnings)
- Ethereum: +1.41% (lagged due to transition and high fees on Layer 1)
Solana’s numbers were driven by growing use, especially on decentralized exchanges, and a surge in tokenized stocks and app revenues.

Looking Ahead: Q4 2026 Scenarios
Now that Solana entered Q4 trading around $117.20, what’s next? Market analysts pointed to three possible paths:
- Bullish Expansion: If Solana breaks above $138.80 maybe thanks to the Alpenglow upgrade or more excitement around Asia-Pacific ETFs it could climb to $155 or even $180.
- Base Consolidation: If things slow down, Solana might bounce between $102 and $125 for a while. But growing wallet numbers give some comfort that people aren’t leaving.
- Bearish Retest: If macro risks come back (say, higher global rates or another round of capital flight), Solana might drop below $94.10, with downside risk to $88.50.
Quick Snapshot: Core Stats for Each Quarter
| Metric | Q1 2026 | Q2 2026 | Q3 2026 |
| Opening Price ($USD) | 102.50 | 112.00 | 98.50 |
| Closing Price ($USD) | 112.00 | 98.50 | 117.20 |
| Non-Vote Transactions (Billion) | 7.54 | 7.19 | 8.92 |
| Main Market Driver | DEX Volumes | Real World Assets, Stablecoins | All-Time Record Transactions, App Revenue |
Conclusion
From wild price swings to surging user numbers and huge growth in decentralized trading, Solana’s first three quarters of 2026 were nothing short of dramatic. The network proved it could weather global economic storms and still grow, attracting more developers, users, and investors. With new upgrades coming and a growing global user base, Solana has set the stage for more surprises and possibly more growth in the months to come.
Disclaimer
This article is for education and news only. It’s not investment or legal advice. Cryptocurrency markets move fast and carry risk always do your own research before making any decisions.