
Table of Contents
Solana Price Snapshot
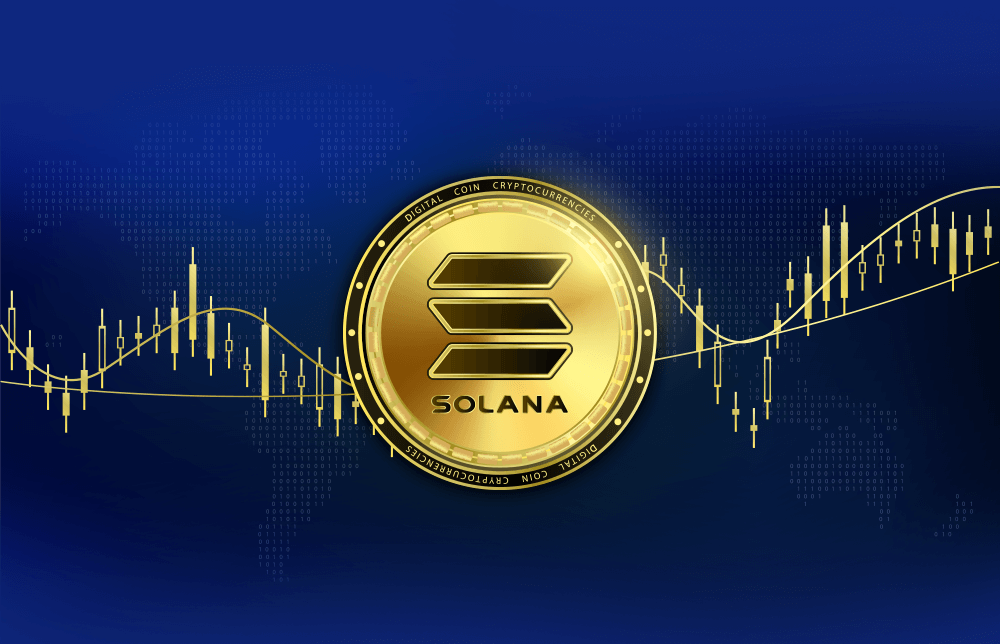
On October 13, 2026, Solana (SOL) posted strong trading numbers. Prices moved within $104.00 and $108.50 USD, or ₹9,851 to ₹10,332 INR, based on live exchange feeds. Early morning trading saw a surge SOL jumped 3.99% in just four hours. That quick rise wiped out $800,000 in short positions on Binance, Bybit, and OKX. After that, SOL held steady above its main support level.
Solana’s global market cap sits between $63.25 billion and $68.5 billion, keeping it in seventh place among the world’s largest cryptocurrencies.
Main Drivers Behind Solana’s Growth
Pando Solana ETF Launches in Hong Kong
Pando Finance debuted its new spot Solana ETF (2831.HK) on the Hong Kong Stock Exchange. With a 0.6% management fee, the ETF gives fund managers across Asia a way to buy SOL directly, tracked by the CME CF Solana Dollar Index. The ETF uses HashKey for custody, and it goes up against Huaxia’s existing Solana ETF in the same market. While U.S. spot Solana funds recently saw outflows, the Hong Kong listing may attract fresh money from Asia.
Circle Injects $3.5 Billion in USDC
Circle minted $3.5 billion worth of USDC on Solana this past week. It’s a big liquidity boost, showing confidence in Solana’s fast and efficient network. More USDC means more action for decentralized exchange trading, AMM pools, and new asset tokenization on the blockchain.
Network Upgrades for Better Performance
Solana hit another milestone by upgrading block production speed from 400 milliseconds to just 200. This change, finished on October 9, has cut down market maker delays without causing network problems. Developers are also testing the new Alpenglow consensus upgrade, aiming to lower transaction finality times from almost 13 seconds to about 150 milliseconds. If it works, transactions will settle almost instantly.

Trading and Technical Levels
SOL is holding above its 50-day Simple Moving Average at $108.24 and well above its 200-day SMA at $86.30. The RSI sits at 46.66, leaving room for further gains.
- Immediate ceiling: $108.00 – $108.24 (50-day average and daily high)
- Medium-term target: $142.06 (projected 7-day algorithmic forecast)
- Key support: $104.00 – $101.60 (local buyer floor)
- Long-term trendline: $86.30 (200-day moving average)
Market Activity and Sentiment
Trading data for October 13 shows 68% of order book entries as buys, and average hold times hit 71 days. Solana saw 17 positive daily closes out of the last 30, with annual volatility around 6.67%. Short liquidations fueled the morning price spike, while long positions stayed untouched, a sign of strong spot demand.
Scenarios for Late October 2026
Bullish Scenario
If SOL closes above $108.24 and trading volume climbs past $118.00, expect the price to target $142.06. This would come from new ETF inflows and fresh USDC liquidity.
Base Consolidation Scenario
If SOL stays between $104.00 and $108.24, it’ll likely move sideways as recent Asian ETF launches soak up extra supply.
Bearish Scenario
If SOL drops below $101.60, momentum could falter and the price might slip toward $86.30.

Summary Table: Solana Key Performance Metrics (October 13, 2026)
- Spot Price: $104.00 – $108.00 USD
- Spot Price (INR): ₹9,851 – ₹10,332
- Morning Volatility: +3.99% surge
- Main Catalyst: Launch of Pando Solana ETF in Hong Kong
- Network Liquidity: Circle mints $3.5B in USDC
- 50-Day SMA: $108.24
- 200-Day SMA: $86.30
- Order Book Sentiment: 68% buy orders, 71-day average hold
Disclaimer
This report is for informational and educational purposes only, based on market data as of October 13, 2026. It’s not investment, legal, or tax advice. Digital assets carry risk and price swings make sure to do your own research before trading.