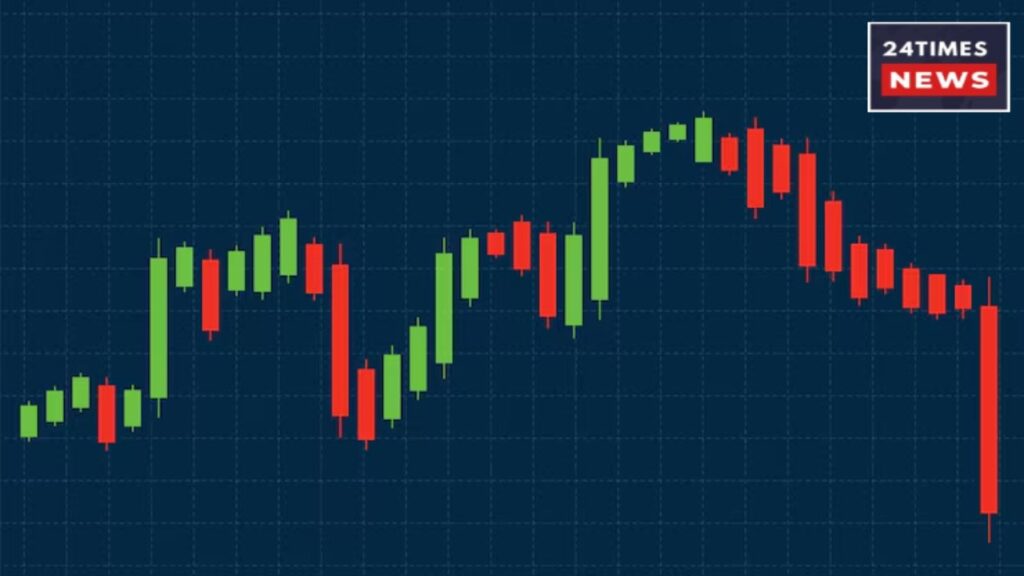
The colorful red and green bars, often referred to as candlesticks, is what the traders of today most frequently spot on stock charts. These straightforward figures are actually quite powerful as they indicate the market emotions — fear, greed, and hope — which are the most common in the investing world. However, very few people are aware of the fact that this widely-used trading instrument has its roots in the times dating back over 200 years and it is located in a time that preceded not only modern stock markets but even the concept of them.
Where It All Began
The candlestick chart came from Japan where it was invented in the 18th century, way before any of today’s technology was available. Japan at that period had a lively trade in rice, which was as precious then as gold is today.
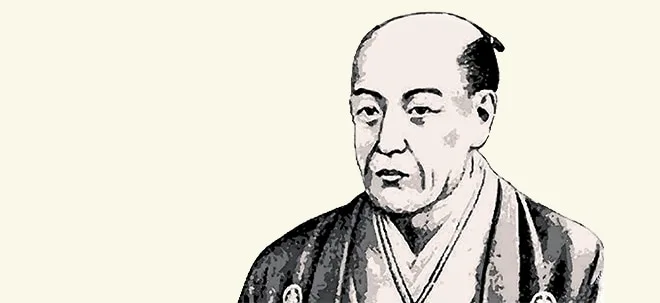
The credit of inventing this technique of price analysis goes to Honma Munehisa, who was a rice trader associated with the Dōjima Rice Exchange in Osaka, Japan. Honma was eager to find out how supply and demand affected the prices, but what concerned him even more was the question about market psychology — how traders’ collective behavior influenced rice prices.
He found out that prices were not just going in response to the physical supply or demand — they were influenced by human psychology as well. If the people did an optimistic forecast, they bought a lot of things. If they feared the worst, they sold as quickly as possible. This was the foundation of his theory.

The Birth of the Candlestick Chart
Honma started to keep track of rice prices every day — noting the open, high, low, and close of each day. He represented those on paper with the help of simple figures that resembled candles and had a body as well as thin lines (wicks) coming out of both sides.
The body displayed the price brackets between opening and closing.
The wicks or shadows were indicating the highest and lowest prices for that day.
If a candle was filled (black) it meant that the price at close was lower than at open.
On the other hand, a hollow (white) candle was showing a higher close.
This simple technique provided him with a way to visually comprehend price behavior — which side was more powerful, the buyers or the sellers. Honma’s principles were later associated with the Sakata School of trading, which are considered to be one of the first instances of technical analysis.
How It Reached the West
Candlestick charting remained largely unknown outside Japan for over 200 years. Only in 1991 did it gain popularity in the West, mainly due to Steve Nison, an American trader and author. Upon the study of old Japanese trading texts, Nison brought the idea to the world financial markets by his landmark publication Japanese Candlestick Charting Techniques.
After that, candlesticks become an integral part of the stock, forex, and crypto trading platforms around the world.

Why It Still Matters Today
Traders still rely on candlesticks to help them make up their minds. The strength of these charts lies in the fact that they bring data and emotions together— they reveal not only the market’s past but also the way it unfolded. A single candle can show if the traders were greedy, cautious, or fearful in that particular session.
Candlesticks are a legacy from the rice markets in Japan to the trading screens of Mumbai, New York, and London. They are there to tell every trader that the market is not only about numbers but also about people — a fact which has been true for over 200 years.


