Table of Contents
Solana Price Action and Market Overview
Strong Performance Amid Derivatives Shake-Up
Solana is holding strong today, trading between $105.80 and $110.40. That’s around ₹10,032 to ₹10,468, depending on the latest exchange rates in India. After last week’s big sell-off across crypto derivatives which cleared out over $800 million in long positions and sent Asian stock markets tumbling Solana has managed to stay resilient. It built a solid support right above $105, keeping buyers confident.
In just the last 24 hours, Solana’s price has moved up by about 1.25% to 2.85%. Buyers are stepping up, defending important technical levels, and SOL’s performance is beating most other Layer-1 coins right now. Solana’s global market cap sits between $64.8 billion and $69.1 billion, easily putting it among the top seven cryptocurrencies.
What’s Driving Solana’s Momentum?
Institutional Investments in Asia
Big investors in Asia are fueling Solana’s current run. Hong Kong’s new Solana spot ETFs especially Pando Finance’s ETF (ticker: 2831.HK) make it easier for asset managers in the region to invest in SOL with fewer restrictions. There’s a steady stream of institutional money coming in, even as Western funds pull back a bit.
Stablecoin Growth and On-Chain Liquidity
Solana is seeing its stablecoin supply, especially USDC, stay strong above $17.8 billion. That’s after Circle minted several billion USDC earlier this month. This deep liquidity boosts activity across Solana’s DeFi apps, staking platforms, and payment systems. Samsung is also rolling out Solana-based USDC micro-payments for Galaxy phone users later in October so demand looks set to grow.
Network Upgrades and Reliability
Solana’s tech keeps getting better. Its validators consistently produce blocks in about 200 milliseconds since a recent upgrade (SIMD-0525). The upcoming “Alpenglow” update is being tested and aims to cut transaction finality from over 12 seconds to about 150 milliseconds. That’s a big jump and could make financial settlements even faster on-chain.

Solana’s Trading Stats for October 16
Spot Price: $105.80–$110.40 (₹10,032–₹10,468)
24-Hour Change: +1.25% to +2.85%
Intraday Low: $105.12 (₹9,967)
Intraday High: $110.40 (₹10,468)
7-Day Trend: -3.8% to -4.6%
Global Market Cap: $64.8B–$69.1B
Retail Buy Orders: 66%
Average Hold Duration: 74 days
Key Macroeconomic Factors
Asia-Pacific Capital Flows
The launch of Solana’s ETF in Hong Kong gives family offices and big investors a smoother route to buy SOL. This ETF, managed by Pando Finance, comes with a 0.60% fee and secure custody through HashKey. It balances out the risk from Western funds pulling back amid U.S. Treasury moves.
Stablecoin and DeFi Activity
Native USDC now totals $17.81 billion on Solana. That keeps the DeFi ecosystem liquid and active. Anticipation for Samsung Wallet’s integration is also boosting medium-term confidence.
Protocol Performance Update
Solana’s validators are reliably hitting their 200ms slot time target. Transaction speeds are up, and skipped slots aren’t causing problems. The Alpenglow upgrade is progressing and should bring even faster settlements.
Technical Chart Review
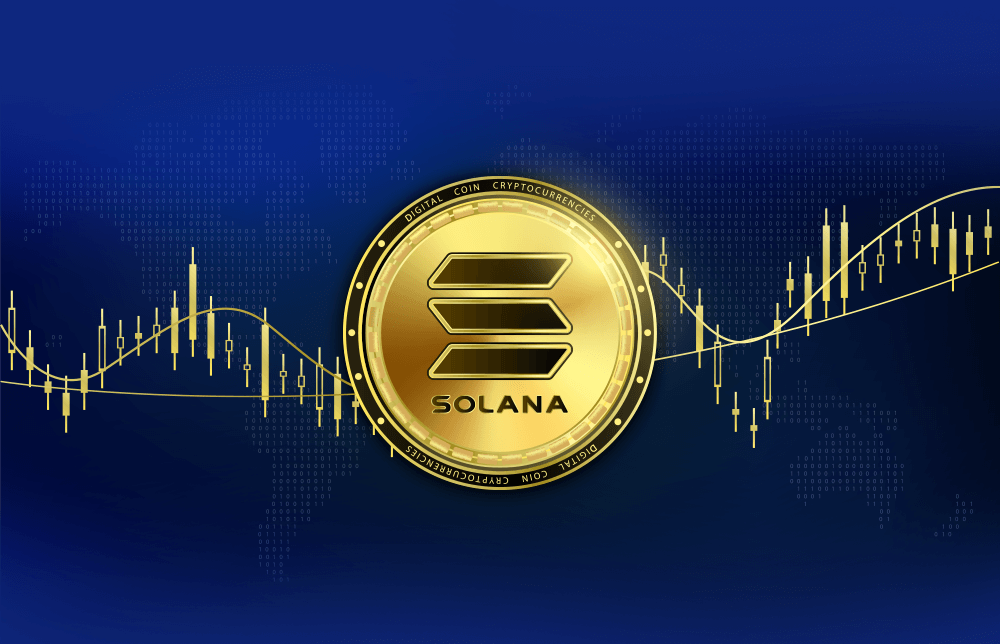
Solana is in a tight consolidation phase, trading near its 50-day simple moving average ($108.85) and way above the 200-day average ($86.50). The 14-day RSI sits at 48.2, so momentum is right in the middle there’s plenty of room to move up.
Immediate Resistance: $110.40 (Intraday High)
Breakout Target: $118.00
Autumn Price Target: $126.00 – $134.00
Local Support: $105.12
Macro Baseline: $86.50 (200-day SMA)
Technical indicators are signaling that Solana remains in an uptrend. Funding rates for derivatives are back to normal, and a daily close above $110.40 could open up a push toward $118.00 and beyond. If prices break below $105.12, though, the next support will be closer to $86.50.
Network Health and Fundamentals
Non-vote transactions hit about 3.2 billion monthly, driven by DeFi and infrastructure activity. Most order books show buyers dominating (66%), and investors are holding for an average of 74 days. Over 65% of SOL is staked, helping keep the network secure.
Late October Outlook: Scenarios
- Bullish Expansion: If SOL closes above $110.40 and holds over $118.00, momentum could carry prices to the $126.00–$134.00 range by month-end. Institutional investors and new Samsung integrations would help push this move.
- Base Consolidation: Prices might stick between $105.80 and $110.40, with buyers collecting coins while watching macro trends.
- Bearish Retest: If prices drop below $105.12, SOL could slip further toward the $86.50 support zone.
Solana Key Metrics (October 16, 2026)
Spot Price: $105.80–$110.40
Spot Price (INR): ₹10,032–₹10,468
24-Hour Performance: +1.25% to +2.85%
50-Day SMA: $108.85
200-Day SMA: $86.50
Major Catalysts: Hong Kong ETFs, $17.8B USDC on-chain
Key Support: $105.12, $101.60, $86.50
Key Resistance: $110.40, $118.00, $134.00
Disclaimer
This article is for educational and market intelligence purposes only. These numbers are based on exchange data as of October 16, 2026. It isn’t financial, legal, or tax advice. Crypto is risky, and prices can change quickly. Always do your own research before trading.